Plotly
Plotly is an open-source Python library for creating interactive and visually appealing data visualizations.
Plotly is an open-source Python library for creating interactive and visually appealing data visualizations. With Plotly, you can create a wide range of charts and graphs, such as line charts, bar charts, scatter plots, heatmaps, and more, and customize them with a variety of options and styles.
Some of the key features of Plotly include:
- Interactive visualizations: Plotly allows you to create interactive visualizations that enable users to explore and analyze data in new ways, such as hovering over data points to see additional information or zooming in and out of charts.
- Support for a wide range of chart types: Plotly supports a wide range of chart types, including scientific charts, financial charts, and 3D charts, making it a versatile tool for visualizing different types of data.
- Customizable styles and themes: Plotly provides a wide range of customizable styles and themes, allowing you to create visually appealing charts that match your brand or style.
- Integration with other Python libraries: Plotly can be easily integrated with other Python libraries, such as Pandas and NumPy, for more advanced data analysis and visualization tasks.
Whether you're a data analyst, data scientist, or just someone who wants to create compelling data visualizations, Plotly is a powerful and easy-to-use tool for creating interactive and visually appealing charts and graphs in Python.
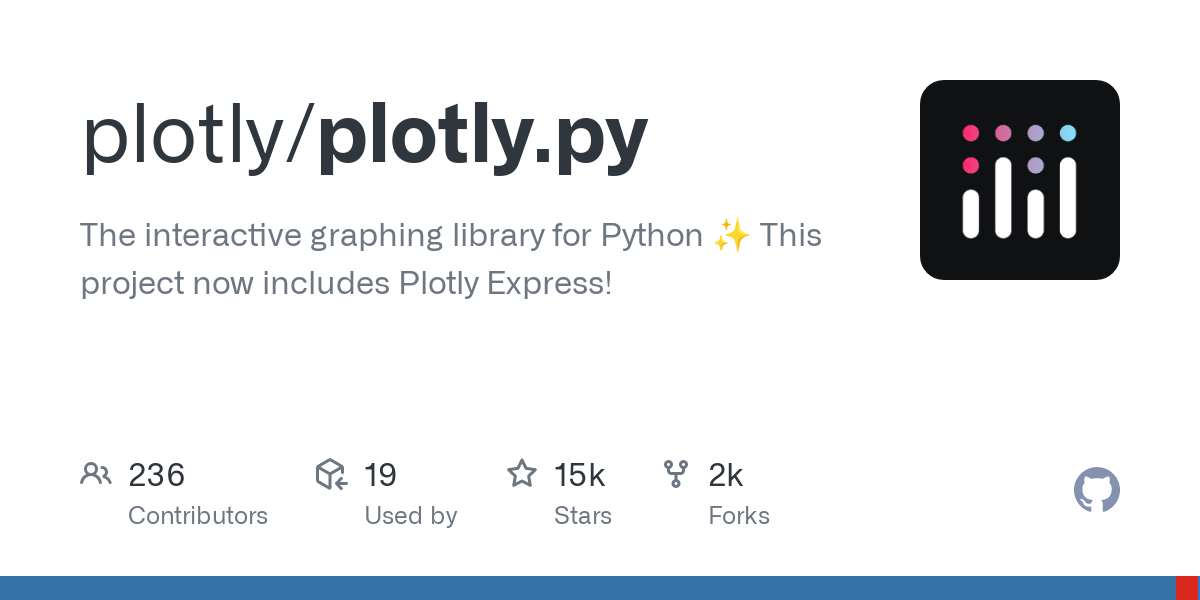
GitHub Stats
💡
Stars: 15k
Forks: 2.5k
Forks: 2.5k